HTTP probes from six regions. No false pages.
We hit your URL every 30 seconds from iad, fra, nrt, syd, gru, and hkg. Alert only on consensus, so a single bad PoP never pages on-call.
When this monitor earns its keep.
Three concrete patterns. Use them as templates for your own setup.
Public API healthchecks
Hit /healthz from outside your own network. Catches failures internal monitoring can't see: 5xx from misconfigured upstreams, BGP misroutes, anycast routing oddities.
Login flows and key endpoints
Probe /api/login with a real test account. Body assertion checks the response contains an expected token. Latency thresholds catch slow degradation before users complain.
Vendor-hosted dependencies
Stripe, Twilio, Auth0. If it goes down you want to know before customer-support tickets start landing. Probe their public health endpoint and alert on the same channels as your own services.
How the setup looks.
Create the probe in the dashboard or with the API. Flat rate per monitor; probe cadence and alert channels do not change the bill.
Same auth, same alert rules, same status pages as every other monitor type. See all 6
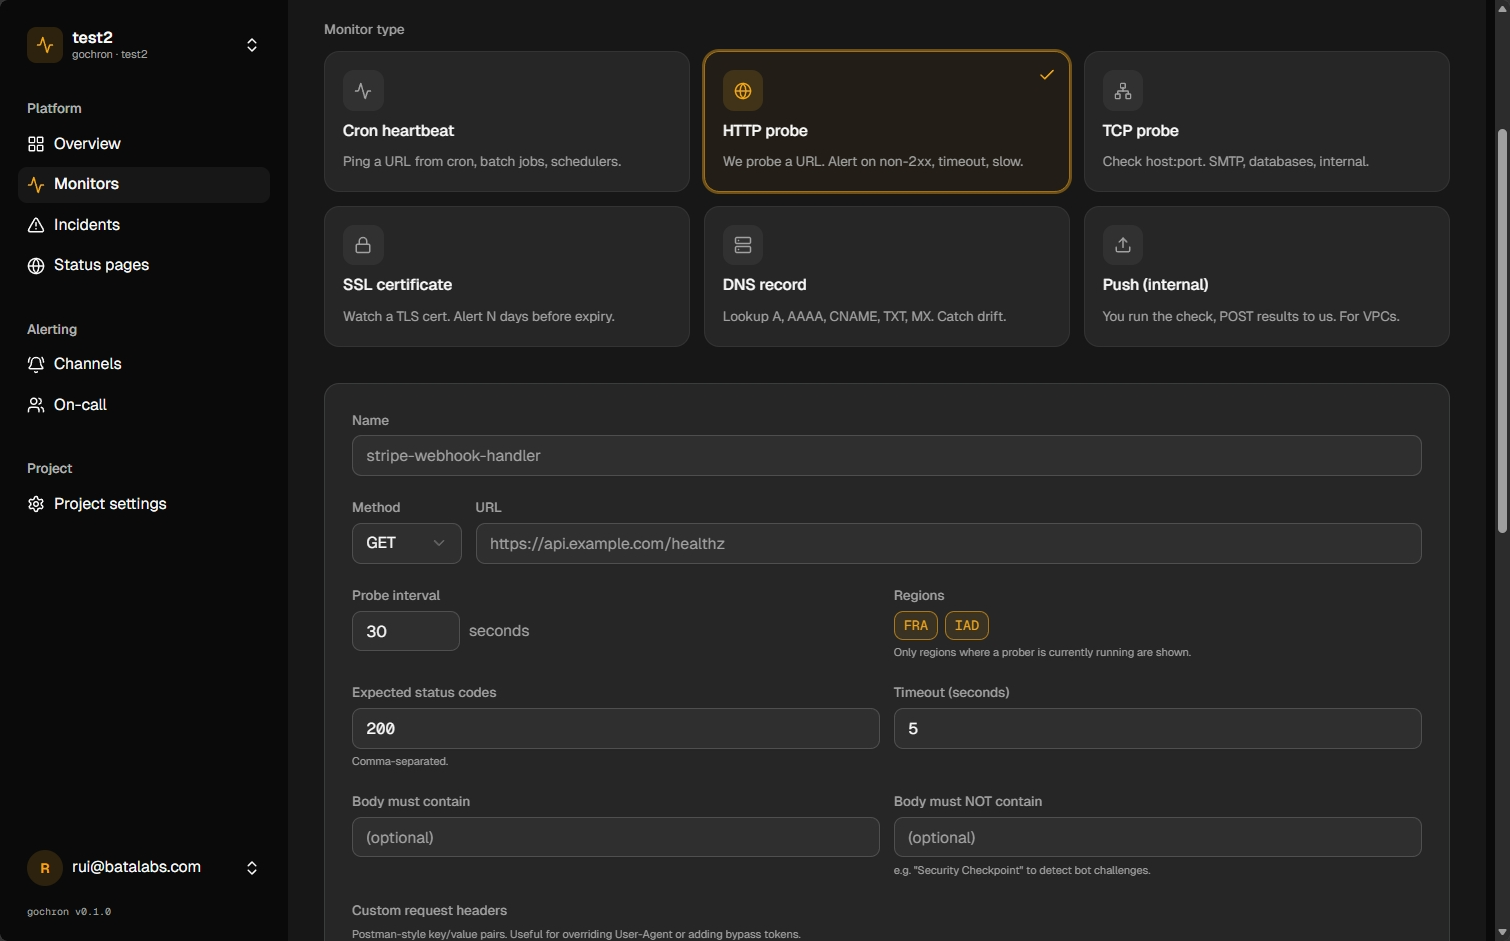
Point at your URL
Set the target URL, pick probe regions, and choose how often we check.
Define what healthy means
Status codes, response time, and optional body checks. Use alert rules for AND/OR logic. For cert expiry and renewal windows, add an SSL certificate monitor on the same host.
Route alerts
Send opens to Slack, SMS, or email. Consensus across regions filters single-PoP noise.
FAQ
- How often do you probe?
- Configurable per monitor: 30s, 1m, 5m. The default is 30s. We charge a flat rate per monitor. Probe cadence doesn't change the price.
- Which IPs do your probers run from?
- Each region has a stable egress IP list, published on the docs page. Add them to your allowlist if your endpoint is gated.
- Can I disable individual regions?
- Yes. Choose any subset of the six regions per monitor. We need at least one for consensus, and we recommend three for incident-grade signal.