TCP reachability checks for everything that isn't HTTP.
SMTP, Postgres, Redis, internal services. We complete the TCP handshake from six regions — not protocol-level checks.
When this monitor earns its keep.
Three concrete patterns. Use them as templates for your own setup.
Outbound SMTP relays
Your transactional mail server on port 587. If TLS negotiation times out, customer onboarding emails stop going out long before anyone files a ticket.
Database listener health
Postgres 5432, MySQL 3306, Redis 6379. Application-level checks tell you the connection pool is healthy. A TCP probe tells you the actual listener is.
Internal microservices
An RPC service on port 9000 inside your VPC. Run a TCP probe from our regions (with a bastion or public LB) to confirm it's reachable end-to-end.
How the setup looks.
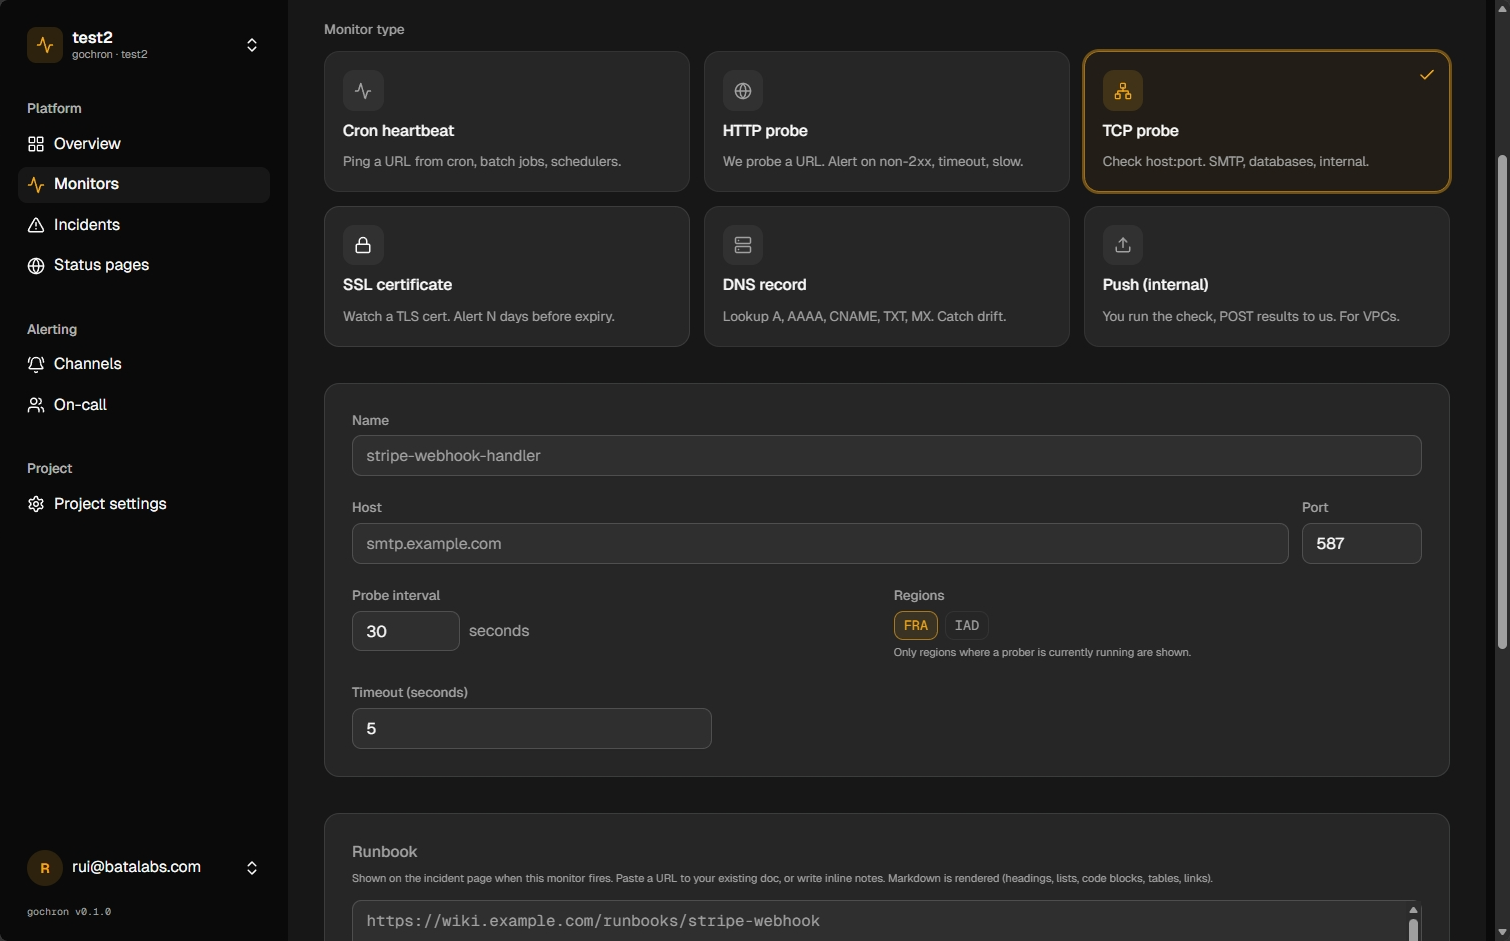
Same flow as HTTP: add a monitor, set host and port, attach alert rules. Flat rate per monitor; extra regions and channels do not add line items.
Same auth, same alert rules, same status pages as every other monitor type. See all 6
Add host and port
SMTP, Postgres, Redis, or any service that speaks TCP. Pick regions, probe interval (30s default), and timeout.
Regional consensus
We require regional consensus by default. One flaky PoP never pages on-call.
See the failure mode
Connection refused, timeout, and reset are stored separately on the incident so you can triage without re-running the check.
FAQ
- Do you check TLS for TCP monitors?
- Use the SSL certificate monitor for cert expiry and chain validation. The TCP probe is a plain handshake, useful for non-TLS ports too.
- What about UDP?
- Not supported today. Most uptime-relevant UDP services (DNS, NTP) have higher-level probes that are more useful. Use the DNS monitor for DNS.
- What's the default probe interval?
- Configurable per monitor: 30s, 1m, or 5m. The default is 30s. Probe cadence is included in the flat per-monitor price.